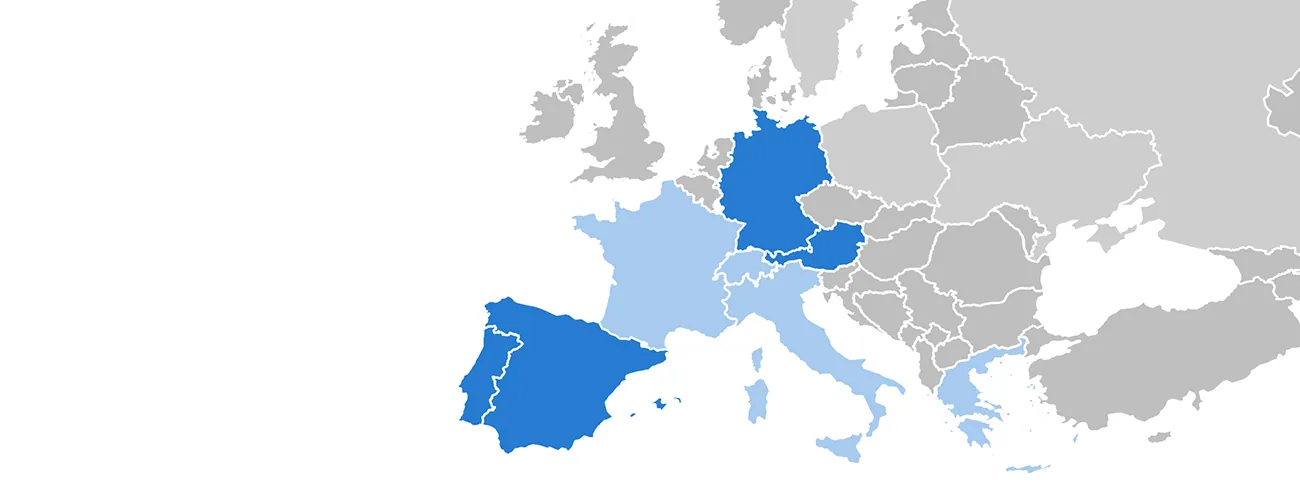
CASAFARI collects data from 16 countries globally
Find out the most desirable areas.
An area guide is a dated, sourced profile of a neighbourhood or town that details transaction prices, rental rates, liquidity metrics, demographic trends, transit connections and local legal constraints. CASAFARI builds these guides by consolidating deduplicated listings across portals, official registry transactions and Location Intelligence. Every figure carries a source and reference date, giving cross-border buyers, investors and estate agents a reliable baseline before committing capital. The live price ticker above displays current prices per m2 and trends.
Imagine sitting at a desk in London with two browser tabs open: a two-bedroom flat in Lisbon described as a “T2” and a “piso de dos dormitorios” in Valencia. Property portals list conflicting asking prices, duplicate listings obscure true market availability, and local terminology varies widely between jurisdictions. Without walking the neighbourhood or inspecting municipal records, evaluating relative market value from afar quickly becomes an exercise in guesswork.
What a CASAFARI area guide tells you in one page
A CASAFARI area guide establishes an objective baseline for a specific municipality, district or coastal town. Rather than relying on portal marketing snippets, each profile brings together market metrics, movement patterns and legal frameworks into a single structured report. Whether evaluating the coastal market in the Albufeira area spotlight, urban regeneration in our guide to Beato in Lisbon, or micro-locations in the Sesimbra spotlight, every guide follows a rigorous template.
These guides serve three distinct professional audiences:
- International buyers: Cross-border purchasers comparing neighbourhoods across different countries before arranging viewing trips.
- Property investors: Institutional and private investors underwriting individual assets, assessing rental yields and evaluating liquidity risks.
- Estate agents: Real estate professionals briefing foreign clients, validating local pricing and backing valuations with verified market evidence.
For real-time pricing, distribution by room count and historical growth trajectories, the live price ticker at the top of this page updates continuously. The text sections focus on the structural, demographic and legal factors that govern long-term value.
What belongs in an area guide, and what does not
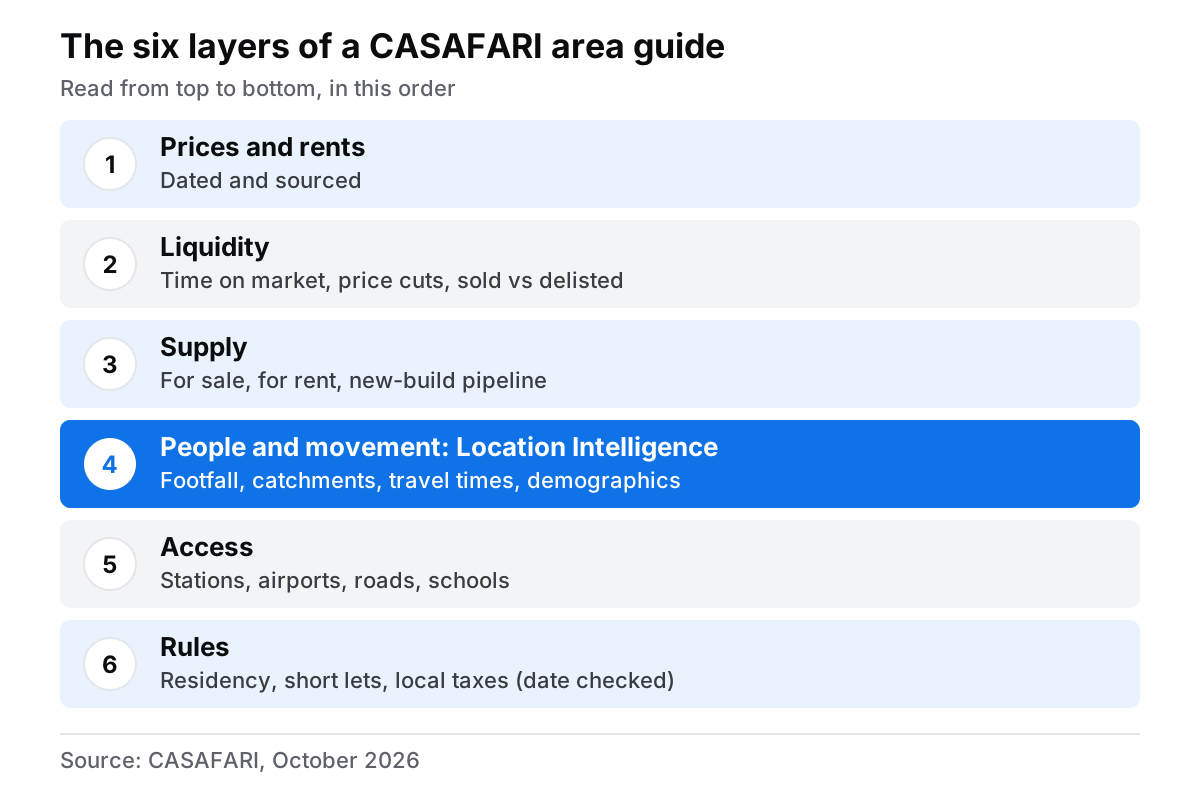
Comparing international property requires translating local market conventions into a unified framework. A “T2” apartment in Portugal, a “bilocale” in Italy and a two-bedroom apartment in the United Kingdom carry different assumptions regarding floor area, layout and common spaces. A comprehensive area guide resolves these differences by standardising property data across six core analytical layers:
- Prices and rents: Sourced median and average figures for sale listings, rental rates and recorded transaction prices, explicitly dated by month or quarter.
- Market liquidity: Metrics reflecting market velocity, including median time on market, the proportion of listings undergoing price reductions, and the ratio of completed sales to delisted inventory. To understand why velocity matters, read our analysis on why time on market matters.
- Active supply: Current available inventory across sale and rental segments, alongside tracked new-build development pipelines.
- People and mobility: Footfall patterns, catchment areas, transit durations and demographic distributions powered by Location Intelligence data from Targomo, following CASAFARI’s acquisition of Targomo in 2023.
- Infrastructure and access: Named transit hubs, international airports, main road networks and accredited schools.
- Regulatory environment: Residency routes, short-let licensing frameworks (such as AL in Portugal or VUT in Spain), and local property tax rates (IBI, IMI, IMT), dated to indicate when regulations were verified.
Conversely, reliable area guides omit undated averages scraped from unverified portals, promotional claims regarding “up-and-coming” districts lacking numerical evidence, outdated municipal statistics, and unsourced valuation estimates. For bespoke neighbourhood breakdowns across European markets, agents and analysts rely on Area Insights reports for any district.
Where the numbers come from and how old they are
Market data is only as accurate as its underlying aggregation methodology. CASAFARI constructs its property graph by indexing listings across thousands of portal and agency sources, applying machine learning algorithms to eliminate duplicate listings. When a single flat appears across five distinct agency sites at differing price points, CASAFARI deduplicates the entry to present a single, accurate market signal. This listing data is supplemented by land registry records and official notary databases where publicly available.
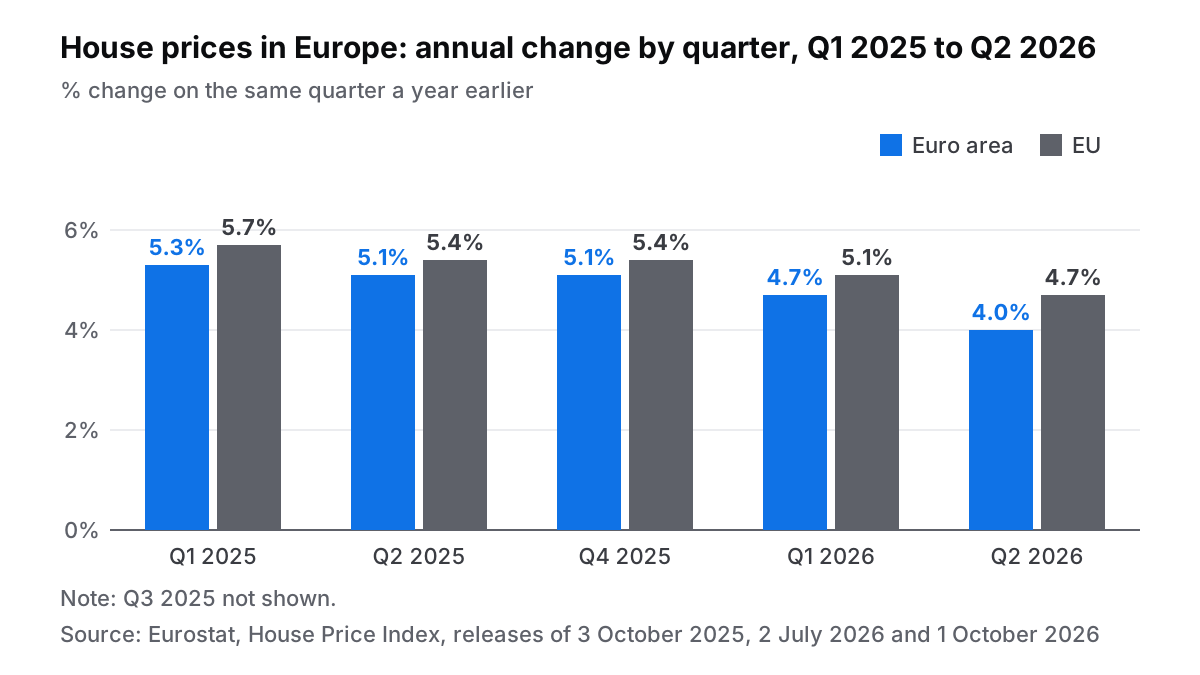
Evaluating local trends requires understanding wider macroeconomic conditions. According to Eurostat’s House Price Index, residential property prices grew by +4.0% year on year in the euro area and +4.7% in the EU during Q2 2026 (released 1 October 2026 by Eurostat’s House Price Index release for Q2 2026). This represents a moderation from Q1 2025 growth rates of +5.3% in the euro area and +5.7% in the EU, as detailed in Eurostat’s release for Q2 2025. Broad continental indices, compiled according to how Eurostat compiles house price statistics, establish general trajectories, but hyper-local price movements within individual city districts vary significantly from national averages.
Developers and data engineers seeking to integrate neighbourhood analytics directly into proprietary software can review the Area Insights documentation on developers.casafari.com (in English). Enterprise users can also open an account on platform.casafari.com to access live analytical tools.
How to read an area guide if you are buying, investing or advising
If you are buying from abroad
When evaluating a property remotely, prioritize liquidity indicators and infrastructure access over headline asking prices. High asking prices accompanied by extending time on market often signal mispriced inventory. Stamped regulatory dates are equally vital; tax structures and short-let licensing rules evolve rapidly across Southern Europe. Always identify variables an area guide cannot capture, such as individual building structural integrity, condominium fee structures, or immediate street-level noise.
If you are investing
Compare active rental asking prices against completed transaction records for identical property typologies to establish realistic gross yields. High advertised yields are frequently eroded by elevated vacancy rates or frequent price discounting in oversupplied micro-locations. Reviewing historical price developments, such as how Lisbon rents moved between 2018 and 2023, illustrates how rental markets adjust over longer economic cycles. For detailed yield calculations, consult our guidance on how to read rental yield.
If you are an estate agent
Use structured area guides as introductory client briefings prior to scheduling physical viewing trips. Combining an area profile with a formal Valuation & Market Study provides clients with complete market context. Through CASAFARI, professionals can review steps for performing a market analysis in CASAFARI and adapt client deliverables by generating a report in your client’s language. Utilizing the CASAFARI GO mobile application and Chrome Extension further allows agents to verify listing histories while conducting on-site visits.
The areas CASAFARI has profiled so far
CASAFARI regularly expands its repository of European neighbourhood profiles, applying a standardised analytical framework to each location. Explore our dedicated spotlights for detailed regional analyses across Portugal, Spain and island territories:
- Algarve: Examine seasonal demand and price distribution in the Albufeira area spotlight.
- Lisbon: Analyse post-industrial regeneration and tech-driven demand in our guide to Beato in Lisbon.
- Setúbal Peninsula: Study coastal commuter dynamics in the Sesimbra spotlight.
Every published spotlight maintains the same rigorous data standards, allowing investors and agents to compare cross-border opportunities systematically. To explore complete data coverage for any European municipality or generate customised reports, visit Area Insights reports for any district.
Frequently asked questions
What should a property area guide include?
A comprehensive property area guide must cover six essential data layers: dated pricing and rental rates, liquidity metrics such as time on market, active supply trends, demographic and footfall data, named transport infrastructure, and local regulatory rules. Every metric should clearly state its data source and reference period. Guides omitting reference dates or underlying sources should be treated as subjective opinion rather than market analysis.
How do I research a neighbourhood before buying property abroad?
Begin by analyzing market liquidity and transit accessibility rather than relying solely on headline asking prices. Compare asking prices with recorded transaction registries for the same property typology, and verify residency, tax and short-let regulations on official government portals. Utilizing data tools like Area Insights provides a consolidated, objective overview of neighbourhood dynamics before you arrange on-site viewings.
How often is the data in a CASAFARI area guide updated?
Property listings and asking prices refresh continuously as portals and estate agencies update their feeds. Official transaction records update according to national registry publication schedules, which are typically quarterly, while macroeconomic indices like Eurostat follow standard quarterly release dates. For detailed breakdown on data synchronization schedules, review our help article on how often source data is refreshed.
Can estate agents use CASAFARI area guides with their clients?
Yes, estate agents can share public area guides directly with clients as market orientation briefings prior to property viewings. For bespoke client presentations, agents can generate white-label Area Insights reports customized with their agency branding and translated into the client’s native language. Detailed instructions are available in our guides on performing a market analysis in CASAFARI and generating a report in your client’s language.