
 Market trends
Follow the property market trends
CASAFARI Area Insights follows the property market in any area of the 16 countries CASAFARI covers: how asking prices and price per m² move, how many homes are for sale, how long they stay on the market and how prices are spread by property type. In Spain, Portugal, France, Italy, Poland and Austria, registered sale prices from official sources sit beside the asking prices.
Which market indicators does Area Insights show?
Area Insights reads the listings of an area and turns them into indicators: average asking price and price per m², time on market for each property type, and the size of the stock for sale. The Heatmap compares areas, Price Distribution shows how prices are spread, and Time Series follows each indicator over the months.
With these figures, an estate agent can explain to an owner why a valuation lands where it does, choose a sales strategy for the area, or tell a buyer whether an asking price is in line with the market.
Start free trial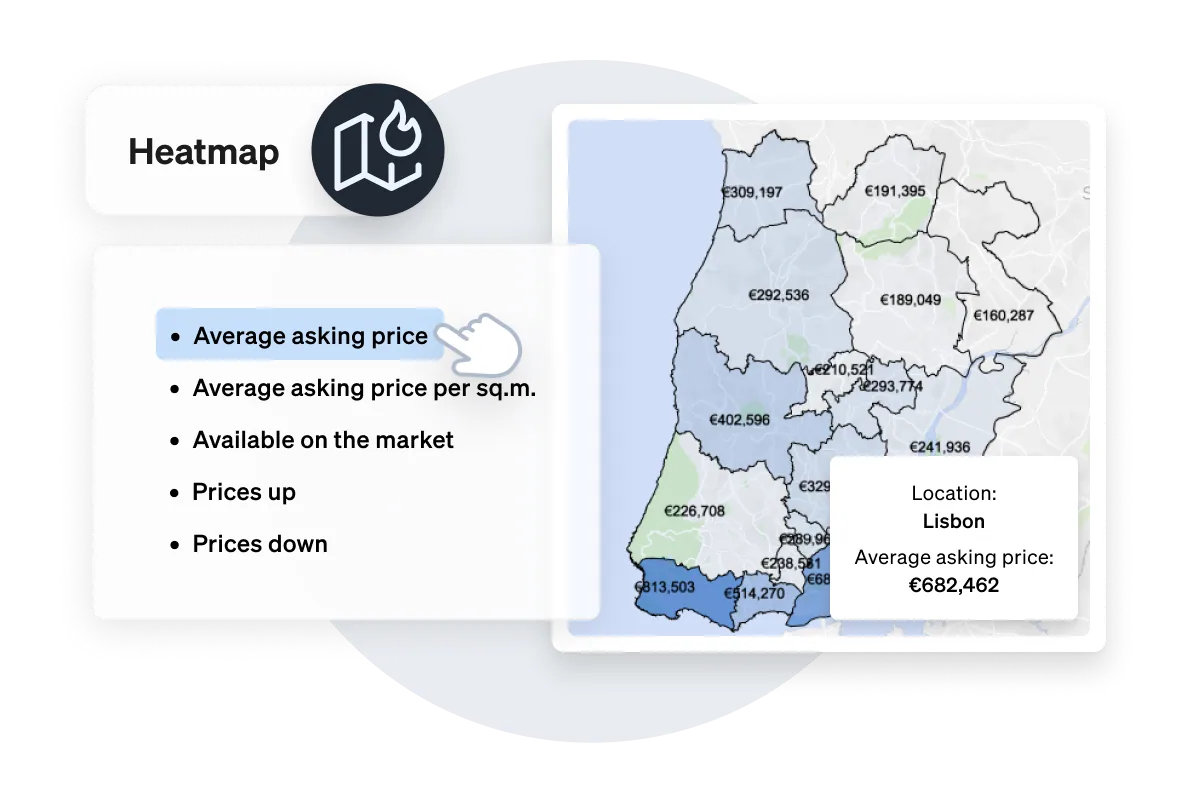
Who uses Area Insights, and for what?
Brokers, estate agents and property investors each read the same market data with a different question in mind: where to grow a team, how to price a home, which asset to buy.
Start free trial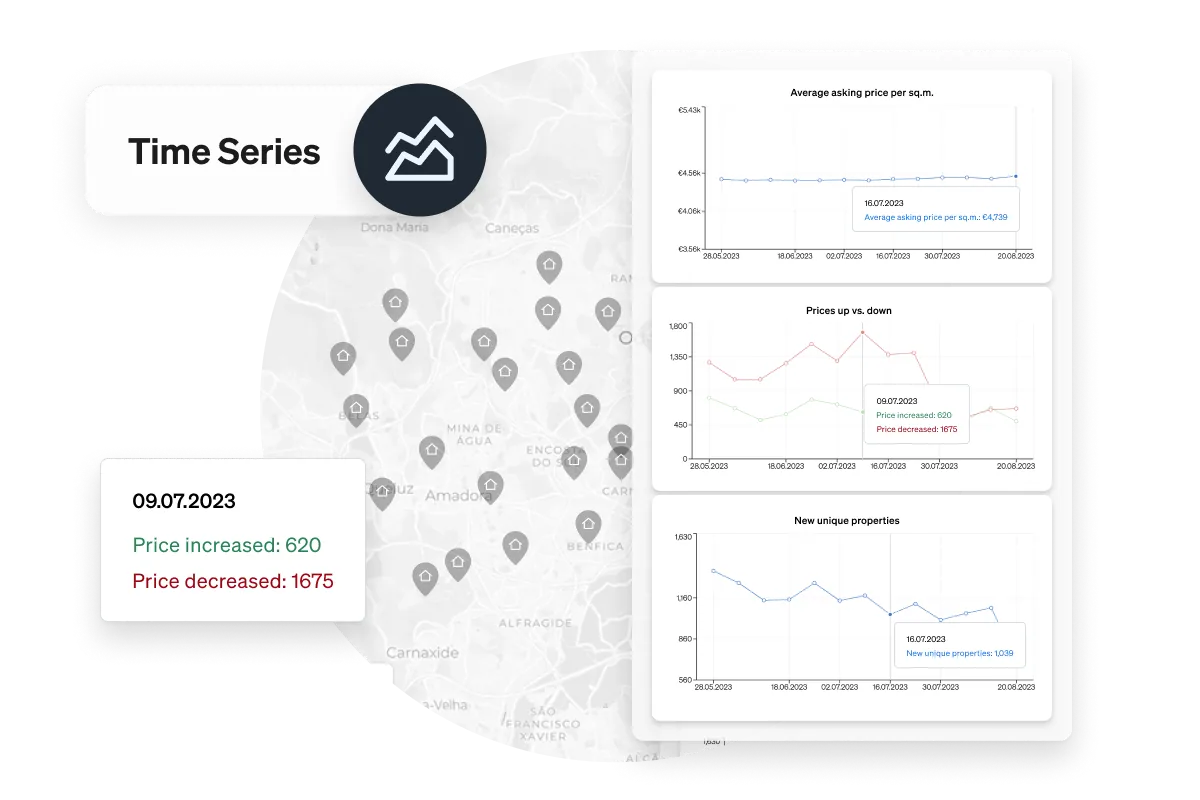
Brokers
See where the stock for sale is growing or shrinking and how quickly homes leave the market, so you know in which parts of the city to grow your team.
Start free trial →Estate agents
Agree the asking price with the owner on the strength of data. Show how prices in the area have moved, the average asking price for that type of property and the comparables that will compete with the home once it is listed.
Start free trial →Real estate investors
Compare areas and asset classes before you invest. Filters for property type, condition and area show where asking prices, stock and time on market point to an opportunity.
Start free trial →What professionals say
With CASAFARI I get to have that indispensable ‘geographic intelligence’ of the local market in just a few clicks.

Registered transaction prices from official sources
CASAFARI holds registered transaction prices: what homes actually sold for, taken from official sources in Spain, Portugal, France, Italy, Poland and Austria, and not only what they were advertised at. They sit beside the listings we index, so asking prices and closing prices can be read side by side.
- Comparables: sold homes with a real closing price carry a purple “closing price” tag and are added automatically when the valuation finds them.
- CMA: the estimate multiplies the average price per m² of your selected comparables by the property's area, so comparables with registered prices count towards the value.
- Market Study: see the average closing price for the kind of property you are valuing in a chosen area, next to current asking prices.
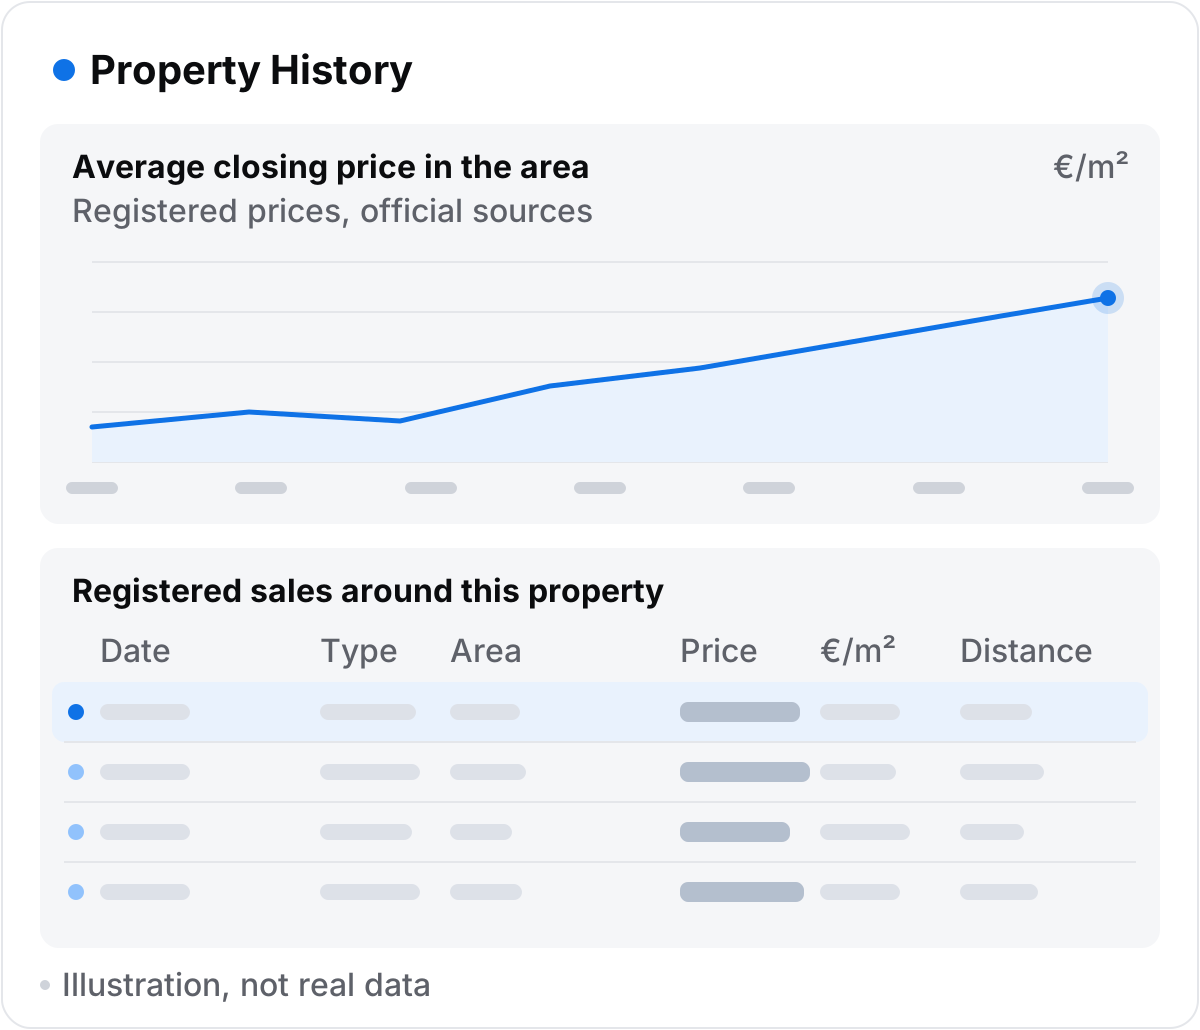
- Property History: every registered sale around the property in Spain, France, Italy and Poland, and how the average closing price in the area has developed. In Portugal and Austria it shows the development of aggregated official statistics for the area.
Official sources: Notariado in Spain, INE in Portugal, DVF in France, Agenzia delle Entrate in Italy, RCN in Poland and Statistik Austria in Austria.
Frequently asked questions
How can I follow property market trends in my area?
In CASAFARI Area Insights, choose an area, a property type and sale or rent. Time Series shows how asking prices, price per m², new listings and sold or withdrawn properties change over the period you choose, and the analysis can be exported as a PDF or a Smartlink.
Are CASAFARI's market figures asking prices or sale prices?
Area Insights is built on listings, so its prices are asking prices. Registered sale prices come from official sources, such as Notariado in Spain, INE in Portugal and DVF in France, and are shown beside asking prices where they exist.
Which areas can I analyse in Area Insights?
For the best results, choose a province, a region or a city. Time Series and Price Distribution do not accept a whole country or a single street, while the Heatmap can compare the areas of an entire country. Our help centre lists which locations you can analyse.
Can I get Area Insights data through an API?
Yes. The Area Insights API and Casafari MCP return the same market statistics for use in your own dashboards, reports or AI assistant. Usage is paid in tokens, and the Area Insights documentation is on developers.casafari.com.
Ready to see it with your own market?
Start a free trial of the app, or use the data through the API and MCP on the platform.