
Area Insights, Simplified
Don’t let the real estate market catch you off guard. Make informed real estate decisions and get valuable insights into property prices, trends, and locations.
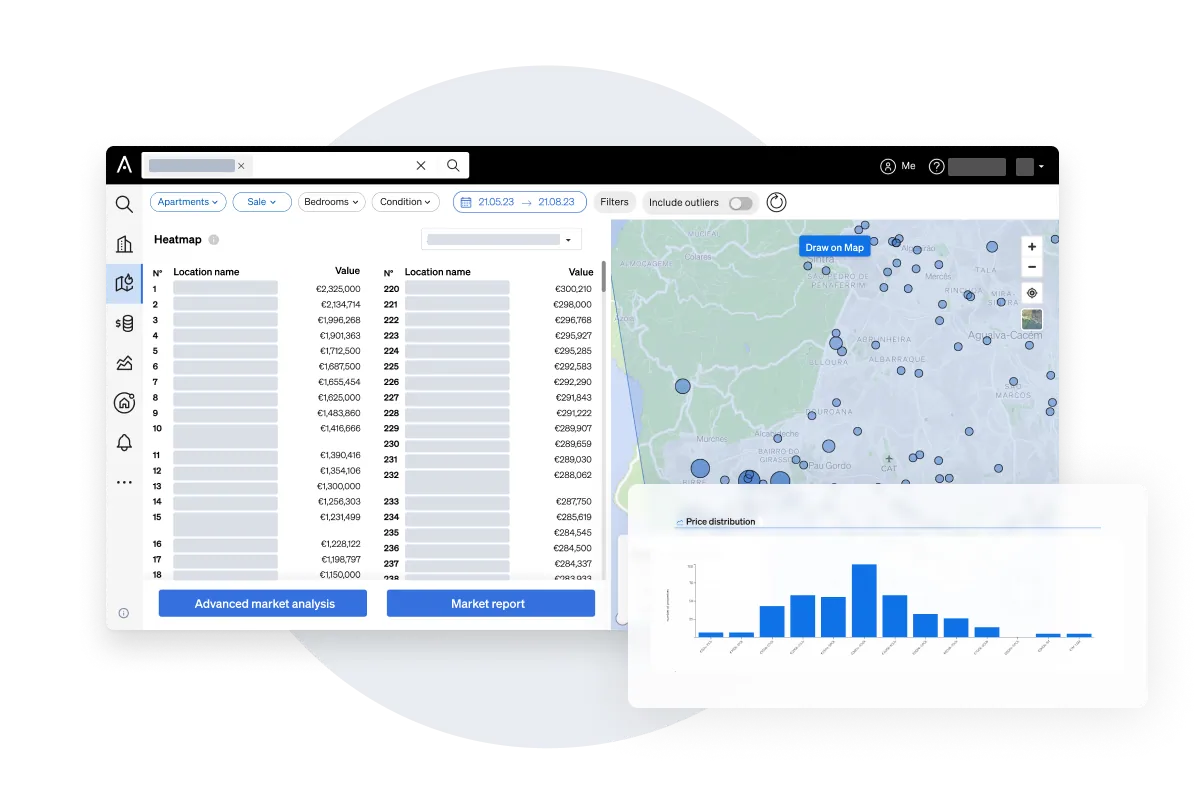
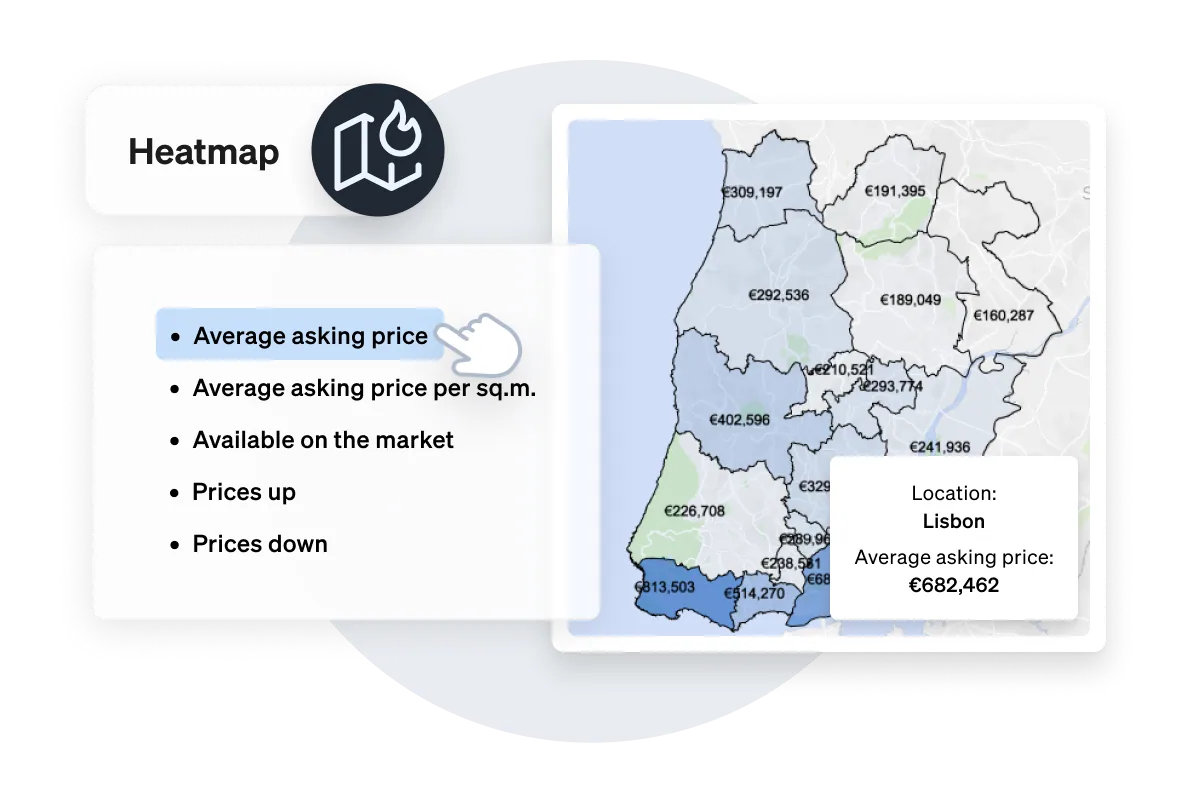
Heatmap
Easily compare locations with color-coded maps. Identify up-and-coming neighbourhoods, high-value areas, and potential investment opportunities.
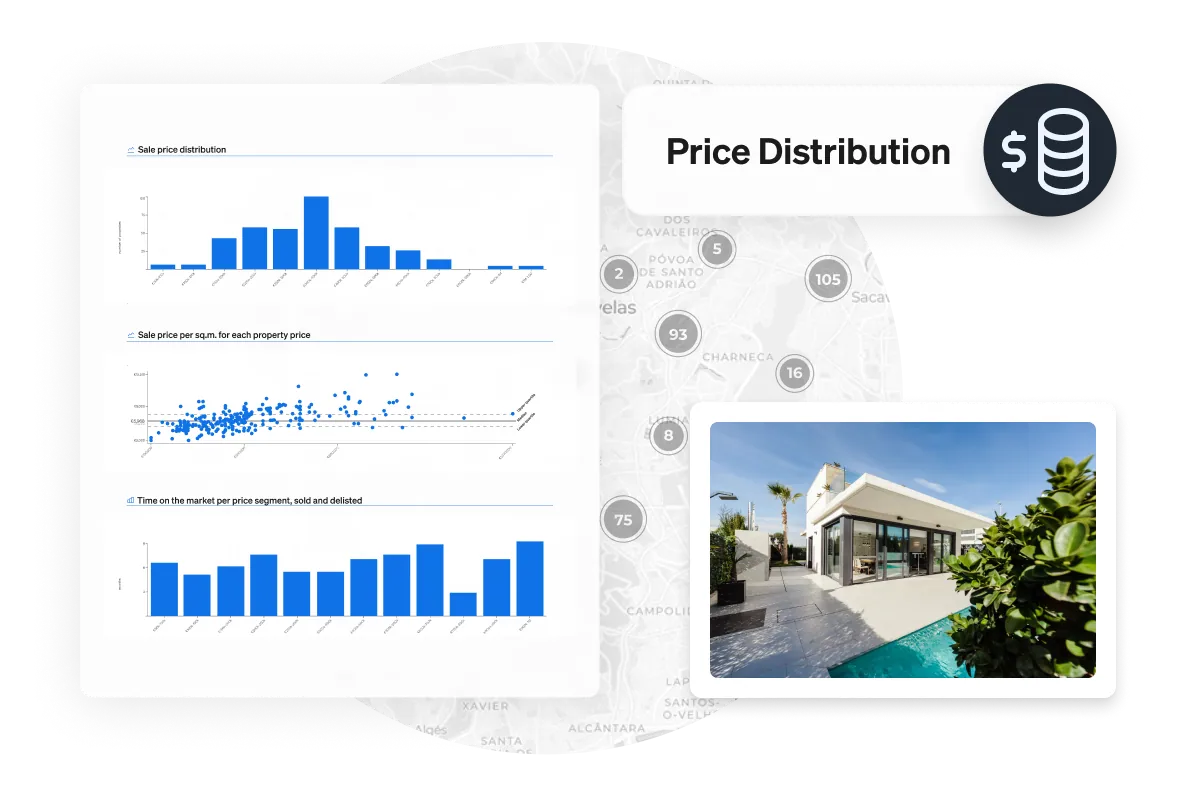
Price Distribution
Visualise property price distributions by type (apartments, houses, etc.) to optimise pricing and stay competitive.
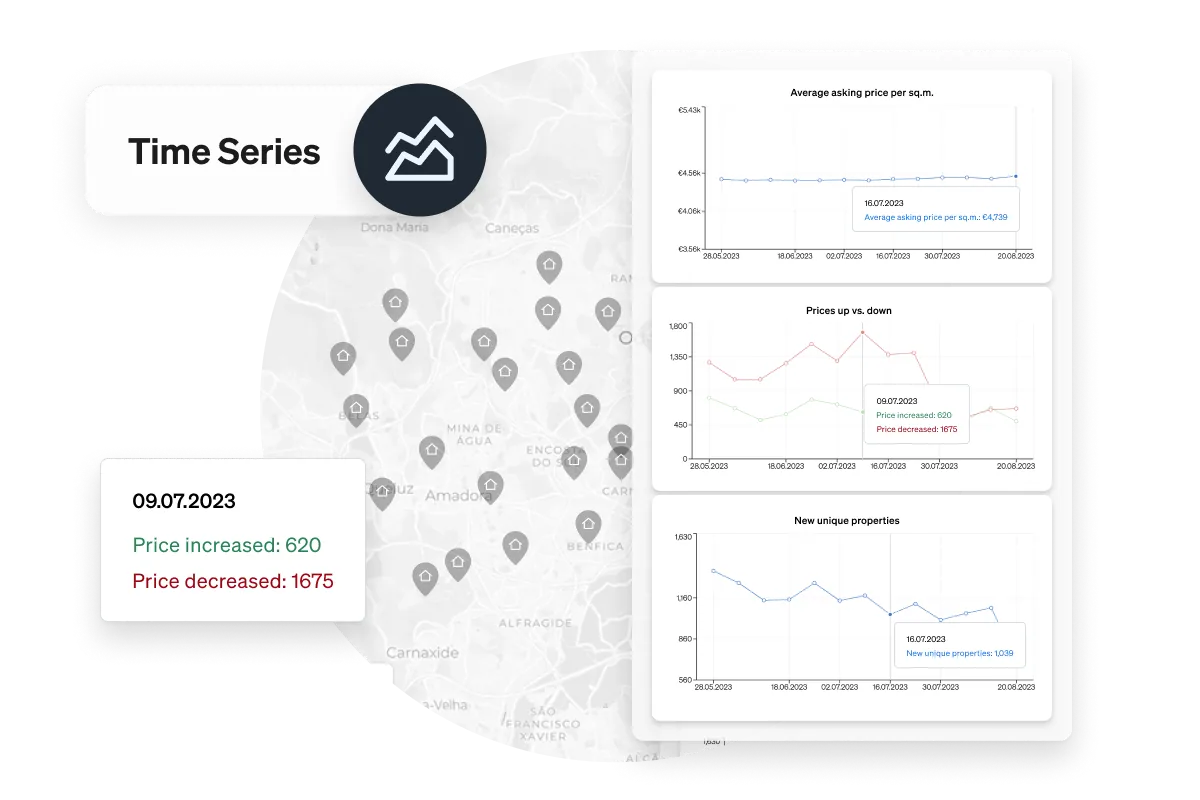
Time Series
Track property trends over time, predict market conditions and make smart investments with historical data.
Testimonials
The tool is easy to use and gives you the possibility to analyse all the information about the market, from the changes in the selling price, to the state of the property or the distribution of pricing across neighbourhoods.

CASAFARI allows me to monitor the changes in the local market because I can see in real-time the exact number of properties for sale and their details.

Registered transaction prices from official sources
CASAFARI holds registered transaction prices: what homes actually sold for, taken from official sources in Spain, Portugal, France, Italy, Poland and Austria, and not only what they were advertised at. In Area Insights and Market Analytics you can set the average closing price of an area beside its asking prices.
- Comparables: sold homes with a real closing price carry a purple “closing price” tag and are added automatically when the valuation finds them.
- CMA: the estimate multiplies the average price per m² of your selected comparables by the property's area, so comparables with registered prices count towards the value.
- Market Study: see the average closing price for the kind of property you are valuing in a chosen area, next to current asking prices.
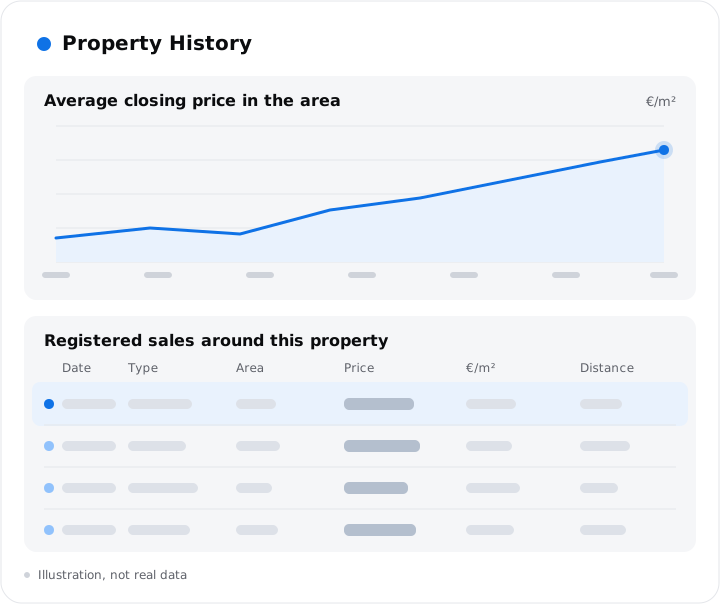
- Property History: every registered sale around the property in Spain, France, Italy and Poland, and how the average closing price in the area has developed. In Portugal and Austria it shows the development of aggregated official statistics for the area.
Where the prices come from
| Country | Official source | What it records | Update cycle |
|---|---|---|---|
| Spain | Notariado (Consejo General del Notariado), through Dato Notarial | Closing prices of registered sales, with basic mortgage information | Direct data feed |
| Portugal | INE, Statistics Portugal | Median transaction prices per m² by municipality and, in larger areas, by parish, built on Tax Authority records | Quarterly |
| France | DVF (Demandes de valeurs foncières), published by the tax administration from notarial deeds | Sales of the last five years in metropolitan France and the overseas departments, except Alsace, Moselle and Mayotte | Twice a year, April and October |
| Italy | Agenzia delle Entrate, Osservatorio del Mercato Immobiliare (OMI) | Prices declared in registered deeds, and minimum and maximum price ranges per OMI zone | OMI zones every six months |
| Poland | RCN, Rejestr Cen Nieruchomości, kept by the county offices from notarial deeds and made available by GUGiK, the national surveying authority | Property prices stated in notarial deeds, in zloty | As deeds are registered |
| Austria | Statistik Austria, property price statistics (Immobilien-Durchschnittspreise) | Average prices of flats, houses and building land by district and municipality, aggregated, not sale by sale | Yearly |
In Portugal and Austria the official data is aggregated by area, not listed sale by sale. Source details checked on 23 October 2026.
Guides and help articles for working with Area Insights
- For real estate professionals running a market analysis today, the help article on performing a market analysis in CASAFARI offers a step-by-step guide to selecting an area, property type, and transaction type.
- To evaluate how neighbourhood prices and stock compare before launching your search, read what the Heatmap tool can do, explained in the help centre.
- Discover practical applications in our post on following property market trends with Area Insights, which shows how tracking asking price movements over time informs agency pricing decisions.
- Once you have analysed location trends, transition to Valuation & Market Study, where an area reading becomes a price for one property using official transaction data.
- For engineering teams building custom workflows with heatmap, price distribution, and time series data, explore the Area Insights API documentation on developers.casafari.com, where API consumption is measured in tokens.
Questions about registered transaction prices
Does CASAFARI have registered transaction prices?
Yes, for Spain, Portugal, France, Italy, Poland and Austria. CASAFARI uses official sources, listed country by country on this page, and shows the registered prices next to asking prices in Comparables, CMA, Market Study and Property History.
Which official sources does CASAFARI use for transaction prices?
Spain: Notariado (Consejo General del Notariado), through Dato Notarial. Portugal: INE, Statistics Portugal. France: DVF, Demandes de valeurs foncières. Italy: Agenzia delle Entrate. Poland: RCN, Rejestr Cen Nieruchomości. Austria: Statistik Austria (aggregated statistics). Details checked on 23 October 2026.
How do Comparables, CMA, Market Study and Property History use registered prices?
Comparables flags sold homes that have a real closing price. The CMA averages the price per m² of the comparables you select to estimate a value. Market Study shows the average closing price of an area next to asking prices. Property History lists the registered sales around a property in Spain, France, Italy and Poland and shows the development of the average closing price in the area; in Portugal and Austria it relies on aggregated official statistics, not individual sales.